IELTS Writing Task 1 – How to Write the Introduction
The introduction is the easiest paragraph in Task 1. Answer three questions in one sentence, paraphrase with four simple tools, and avoid three common mistakes.
Key points
The example question from the video
The graph below shows the number of people who visited three public libraries in a town between 2012 and 2022.
Model introductions from the video (140 words)
Line graph. The line graph illustrates how many visitors three public libraries in one town received over a ten-year period, from 2012 to 2022.
Bar chart (question: the percentage of adults who did regular exercise in four countries in 2000 and 2020). The bar chart compares the proportion of adults who exercised regularly in Japan, Brazil, Kenya and Sweden in 2000 and 2020.
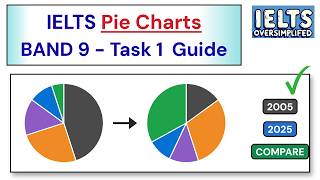
Pie charts (question: the main types of household waste collected in one town in 2000 and 2020). The two pie charts break down the household rubbish collected in one town into five main categories, in 2000 and 2020.
Table (question: the average price of a cinema ticket in five countries in 2015 and 2025). The table presents the average cost of going to the cinema in five countries, comparing ticket prices in 2015 with those in 2025.
Paraphrasing swaps from the video
| Word / phrase | Meaning | Example |
|---|---|---|
| shows → illustrates / compares / presents / gives details of | change the verb (present simple) | The line graph illustrates how many visitors … |
| graph → line graph; chart → bar chart | name the visual exactly | The bar chart compares … |
| percentage → proportion | change the word | the proportion of adults who exercised regularly |
| did regular exercise → exercised regularly | change the word form | adults who exercised regularly |
| waste → rubbish | change the word | the household rubbish collected in one town |
| show the main types of → break down … into … categories | a useful phrase for pie charts | break down the household rubbish … into five main categories |
| between 2012 and 2022 → over a ten-year period, from 2012 to 2022 | change the time phrase | over a ten-year period, from 2012 to 2022 |
Practice task: Electric cars (from the video)
The graph below shows the number of electric cars sold in four countries between 2018 and 2024. Write the introduction only: one sentence.
What kind of visual? What does it measure? Where and when?
Change the verb, a few key words and the time phrase.
No numbers or trends. Those belong in the overview.
Show model answer (try first!)
The line graph compares how many electric cars were bought in four countries over a six-year period, from 2018 to 2024.
21 words
Keep going